Feature Map
Every control in Metabolistic, page by page — what each button does and where to find it. Skim it to look something up, or read it through to discover features you didn't know were there. Nothing here is required reading; the app works without it.
The header (on every page)
The bar across the top is the same wherever you are.


- Metabolistic (the wordmark, top-left) — your Home button. Click it to return to the landing page.
- Features — the landing page tour: what the app does and why.
- Demo — loads a ready-made dataset so you can explore the full dashboard without importing anything.
- Resources ▾ — the content menu: guides, articles and more. Product Guides (where this page lives) covers how to use the app.
- About ▾ — the project pages: Origin Story, Changelog (what's new), Roadmap (what's coming), and Contact.
- Sign up / Sign in — create an account or log in. Once you're in, this becomes Account.
- Theme toggle (sun/moon, far right) — switches between dark and light. The icon shows the mode you'll switch to.
- Sync (refresh icon) — appears only on the dashboard when you've linked a Google Sheet; pulls the latest rows from your sheet.
Dashboard
Your numbers, top to bottom. It builds from a headline summary down through the Input → Output → Outcome story.
Summary — the headline answer
Two side-by-side panels. The left (blue) is your main period; the right (green) is a recent window for comparison.
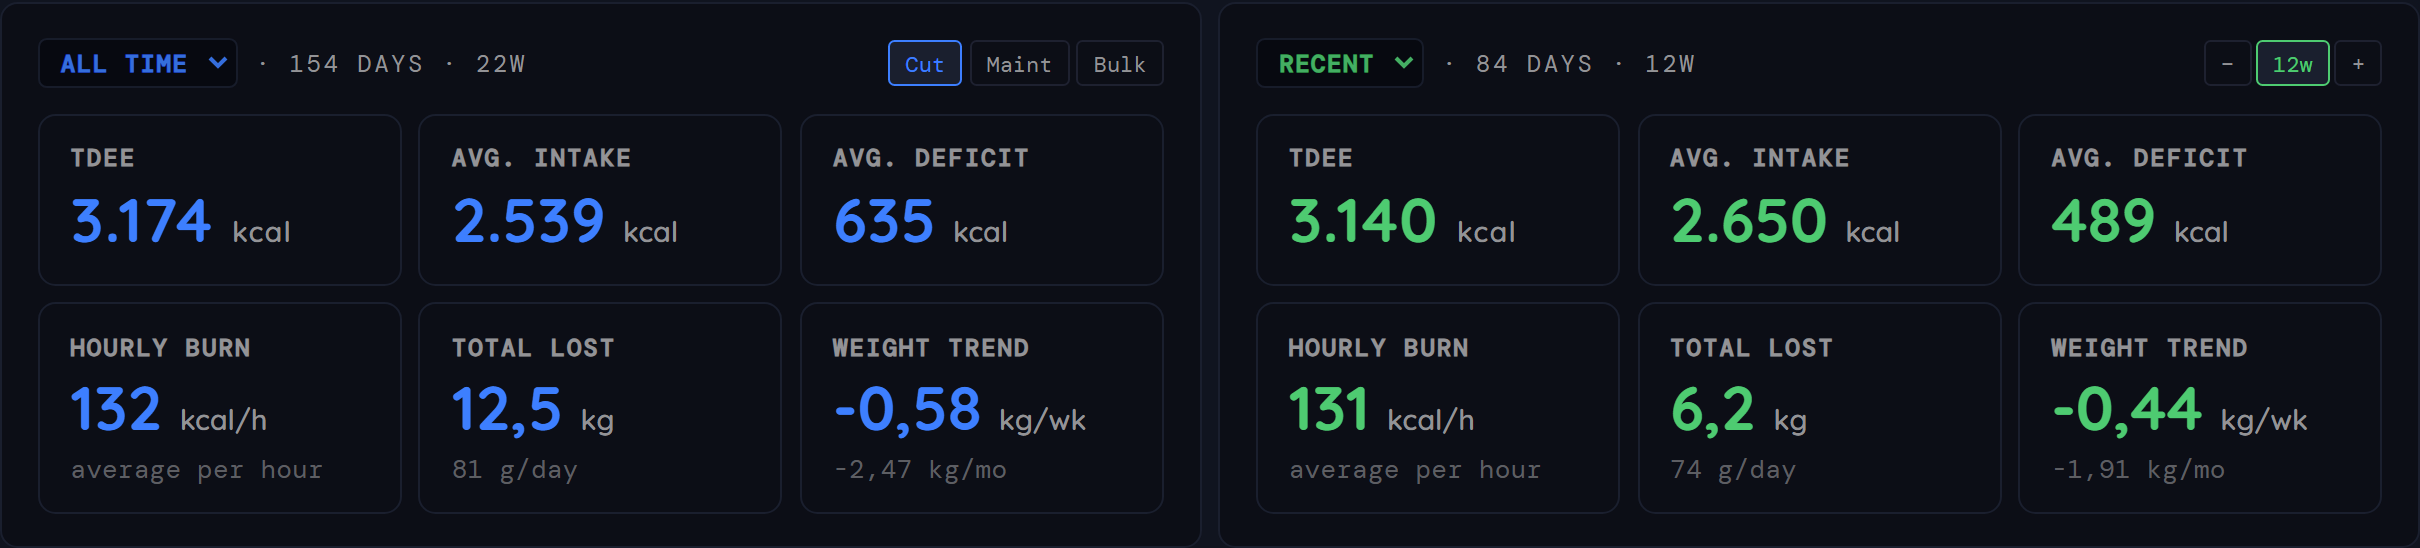
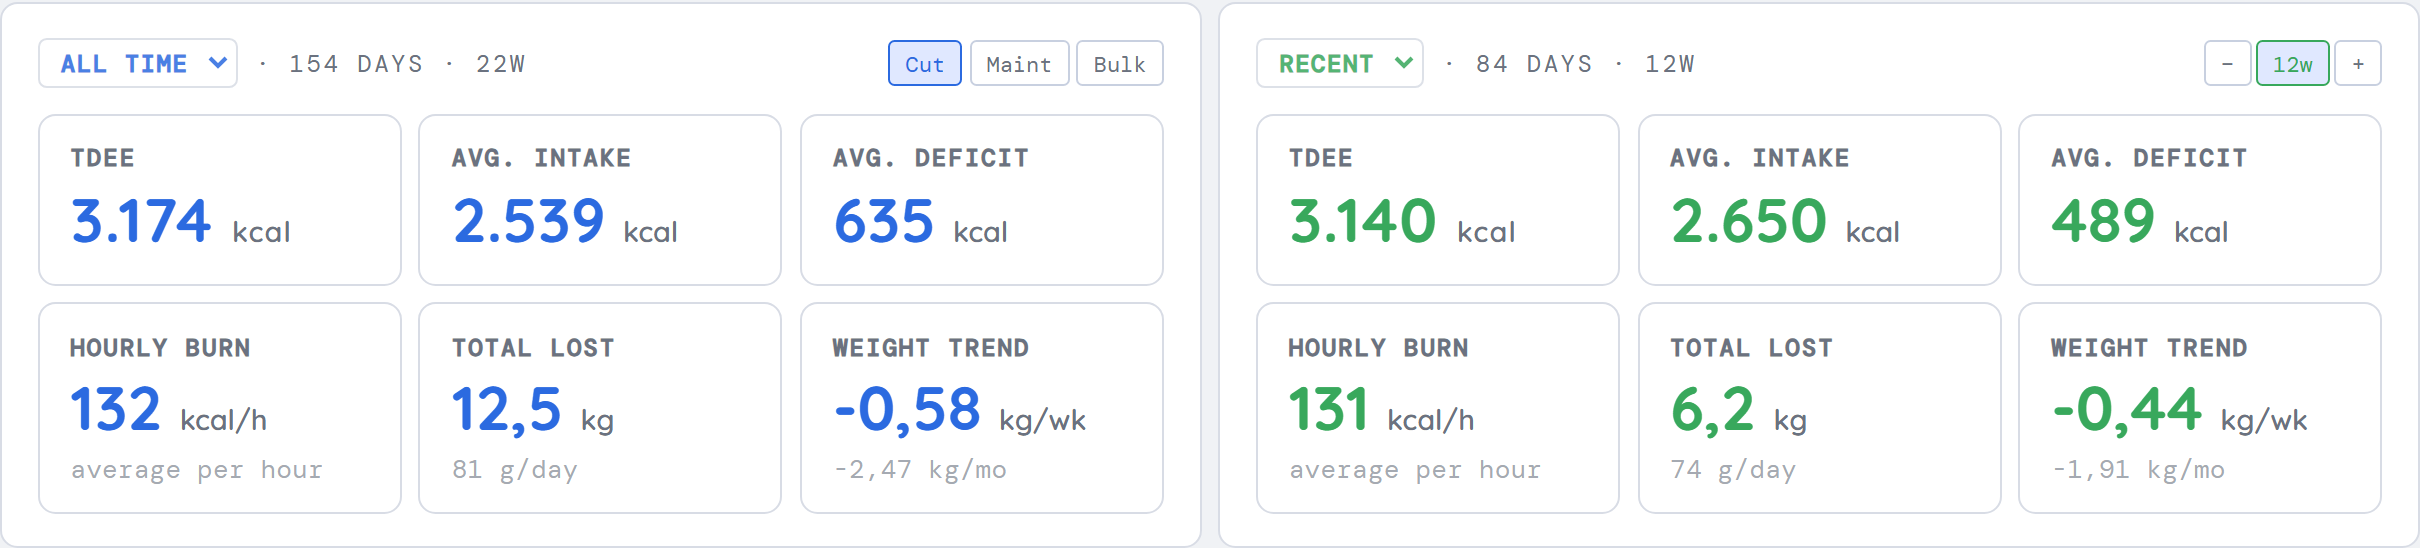
- Period selector (the dropdown in each panel header, e.g. All Time / Recent) — picks the date range that panel summarizes. The left panel's range drives the whole dashboard.
- Cut · Maint · Bulk (top-right of the blue panel) — the perspective lens: tells the app whether to read your numbers as a cut, maintenance, or bulk. It changes judgment, not your data.
- Week stepper (
− 12w +, top-right of the green panel) — sets how many recent weeks the comparison window covers (2–52). - The six numbers in each panel — Avg. TDEE (what your body burned, averaged across the period this panel covers), Avg. intake, Avg. deficit (or surplus), Hourly burn, Total lost (or gained), and Weight trend. They auto-relabel by direction, so a surplus reads "surplus", not a negative deficit.
- Share (top-right of the gauge, beside the ?) — generates a branded card of the number the gauge is showing: what you burn today, to save or post.
Overview — weight & trend
The chart everything else builds on: your weigh-ins plus the smoothed trend line.
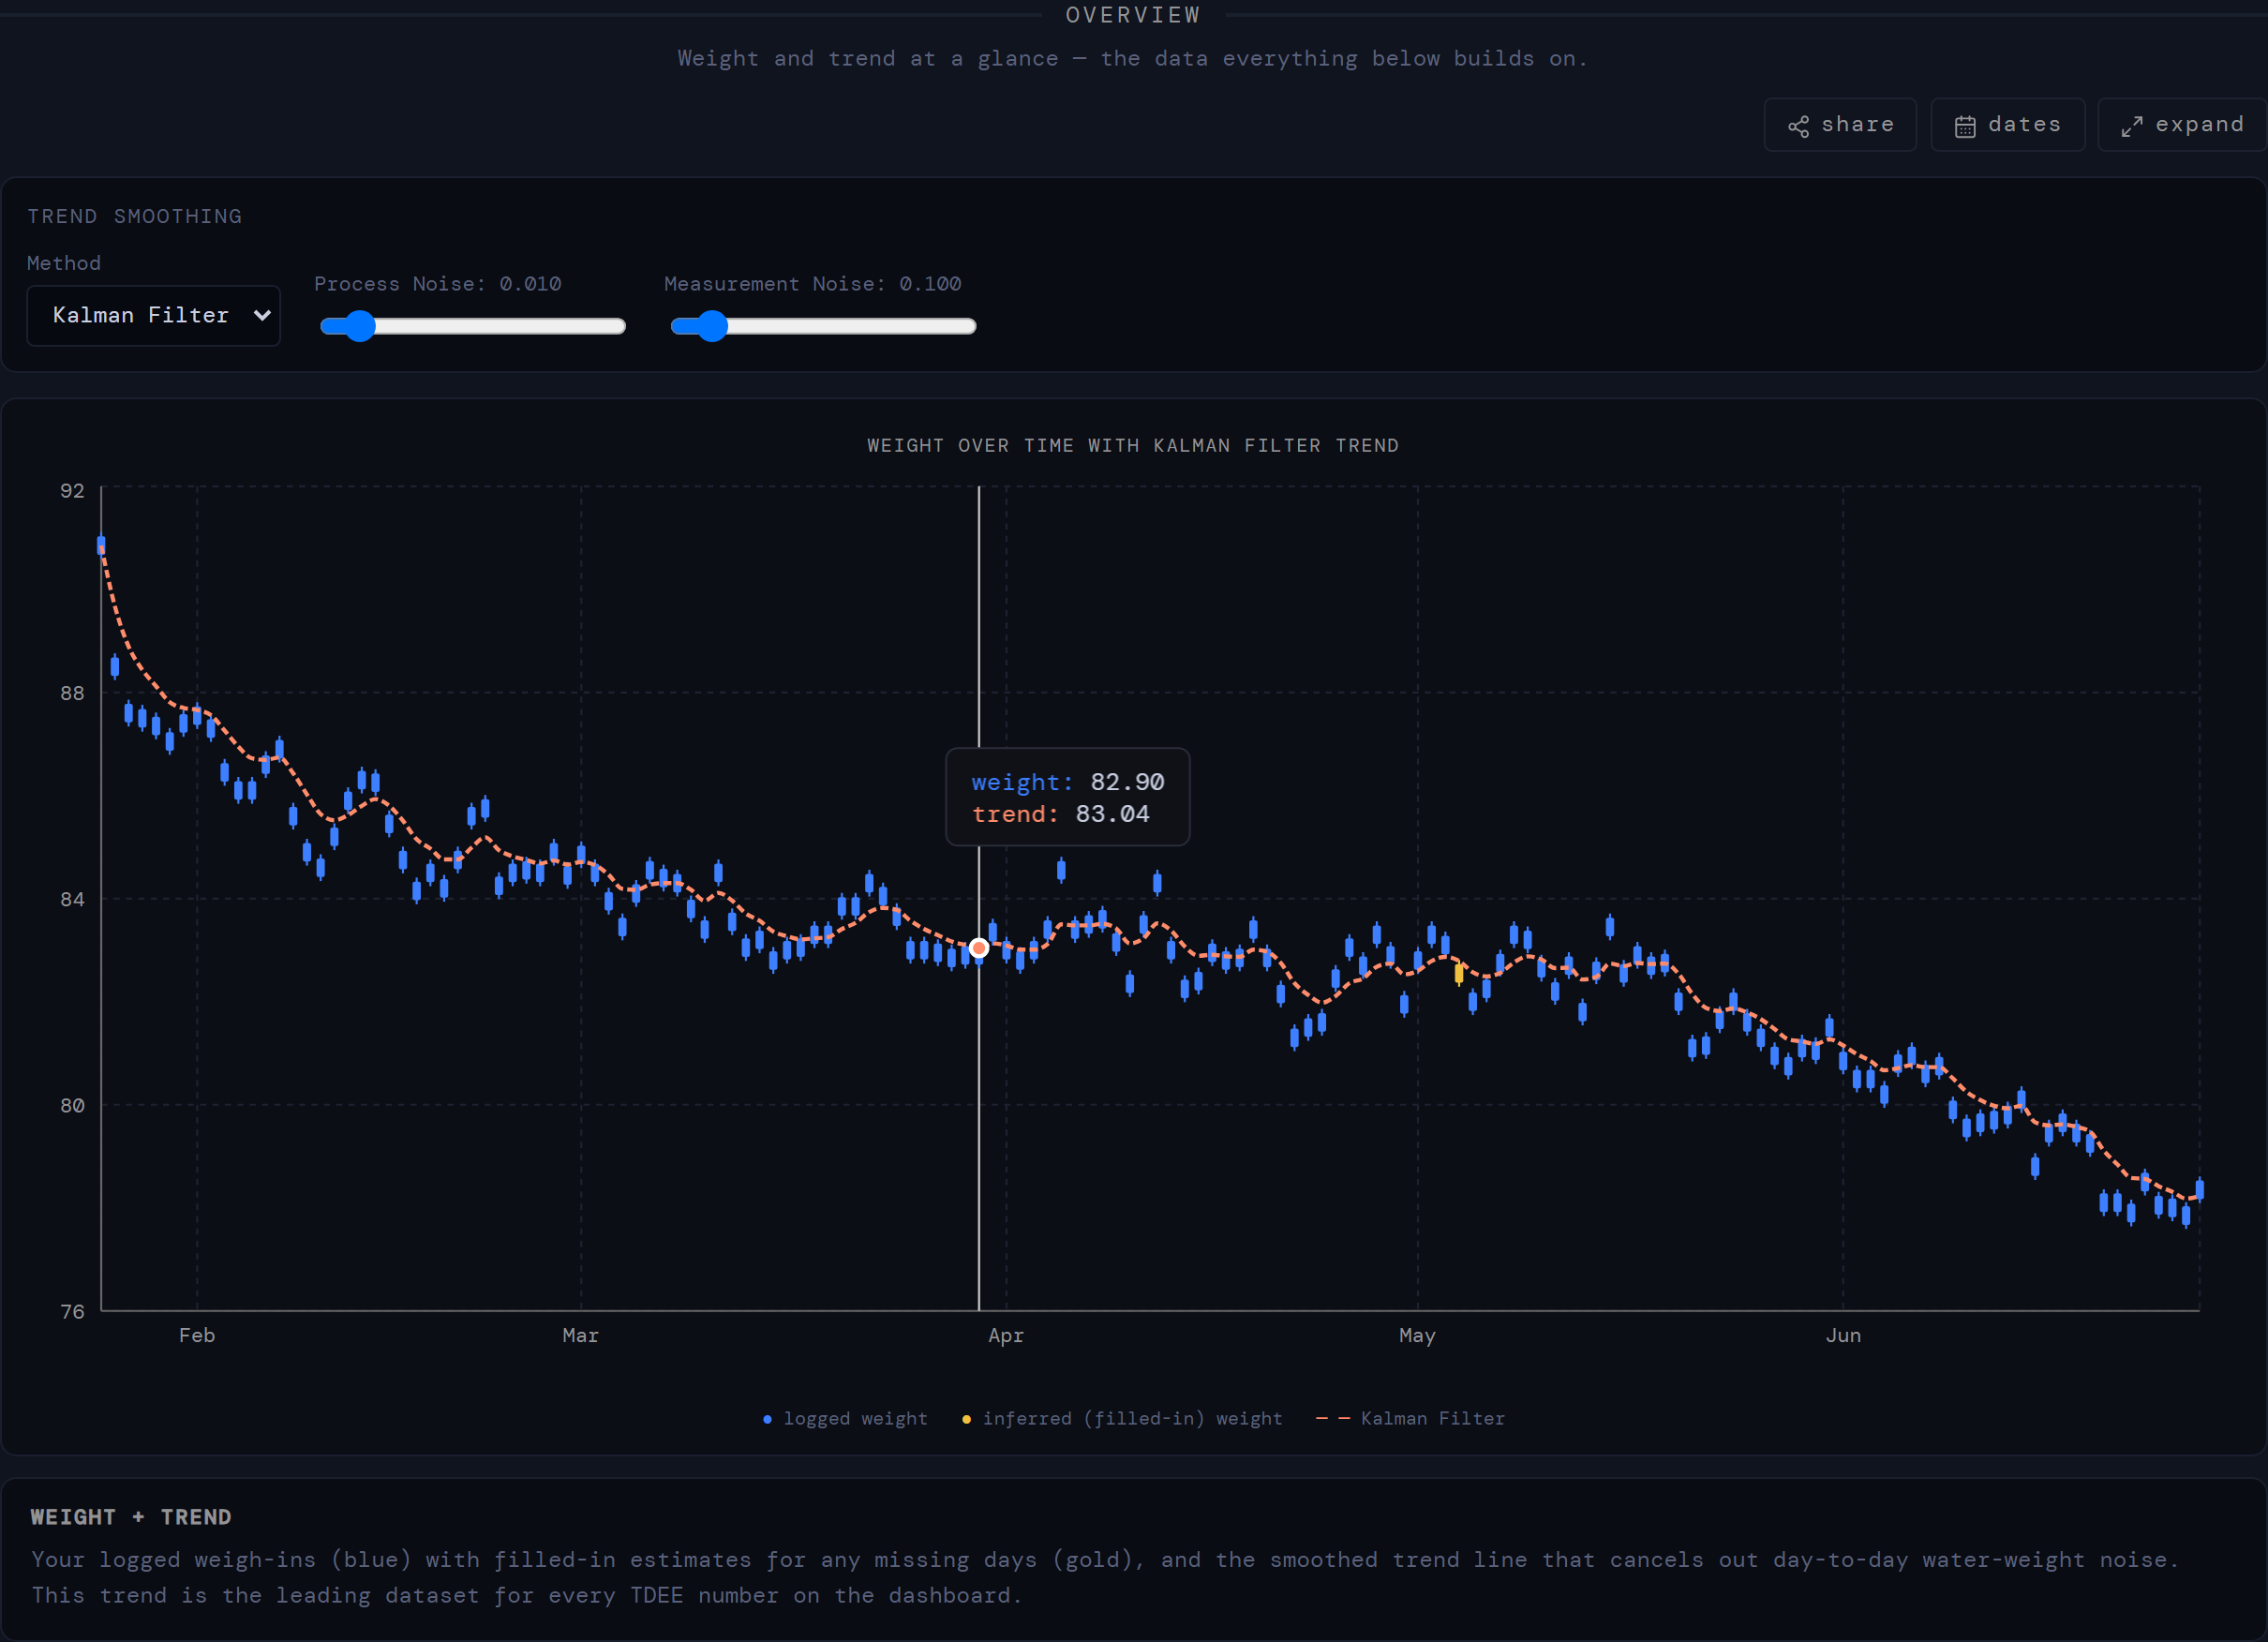
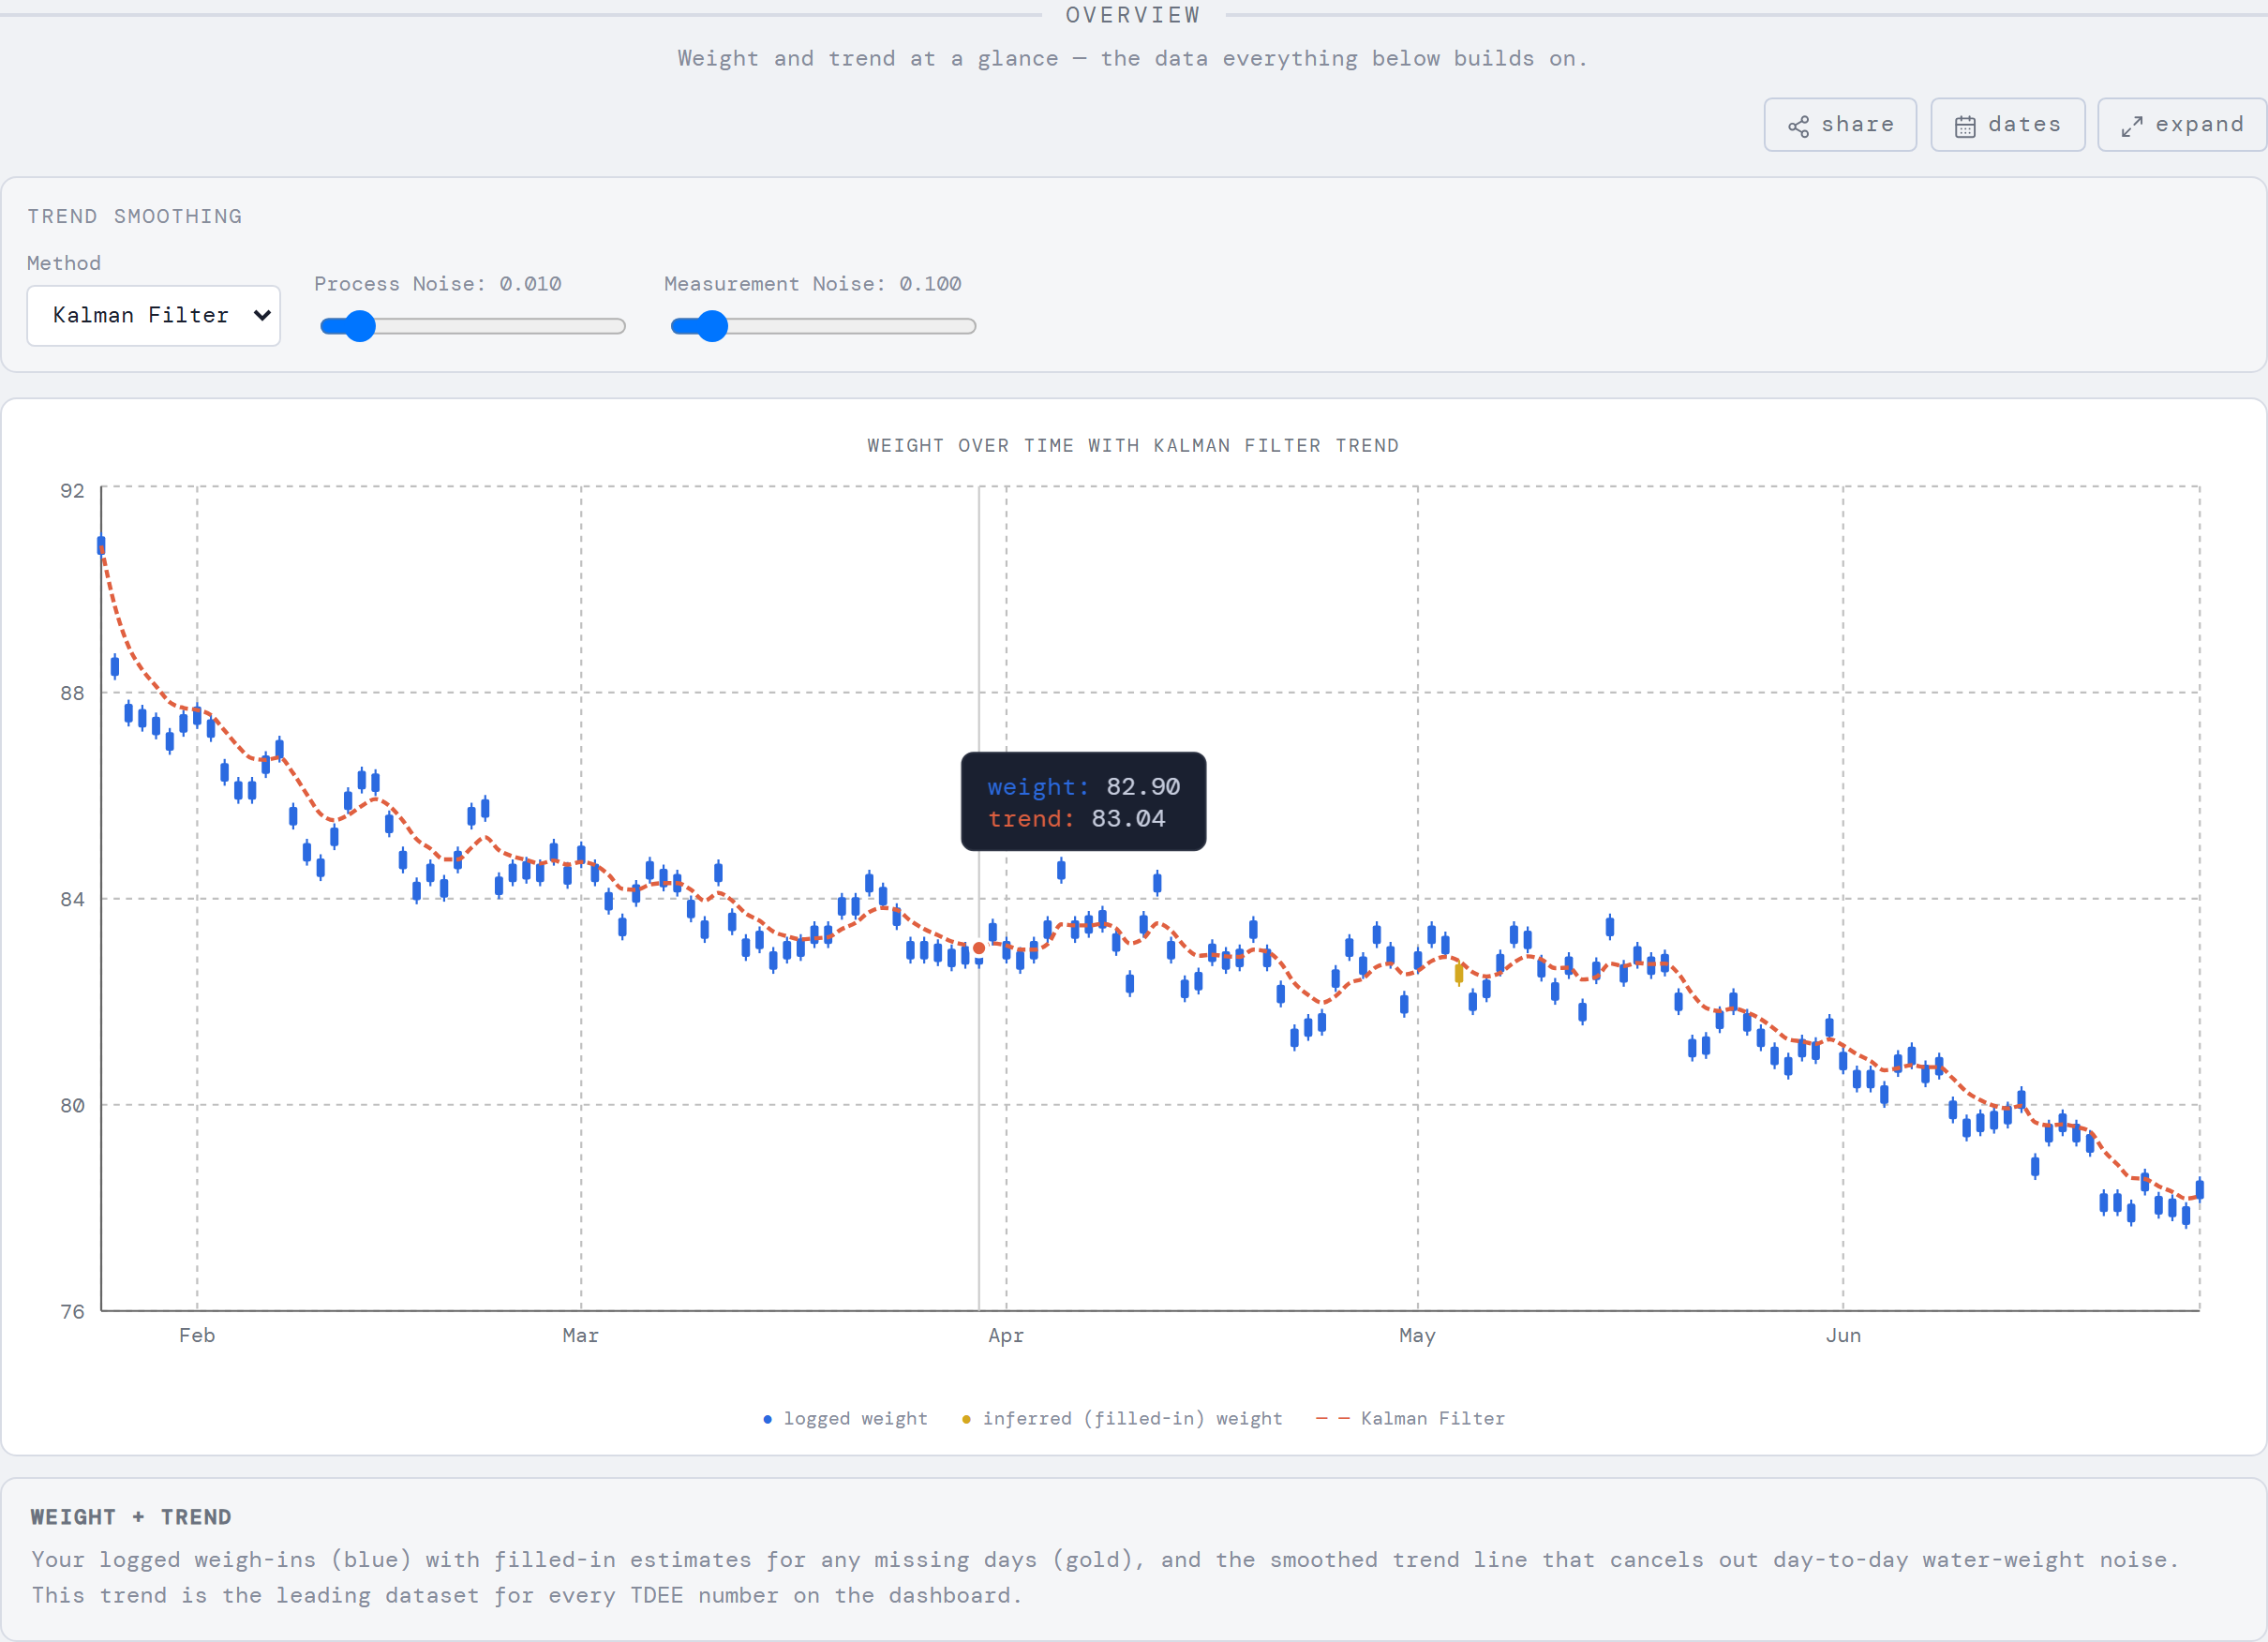
- The trend line — smoothed in both directions, so neither your first nor your latest weigh-in can drag it around. It has no controls, on purpose: this is the exact line every TDEE number is measured from, so what you see is what is measured. See smoothing your weight trend.
Input — Calorie Intake
What you eat, the part you fully control.
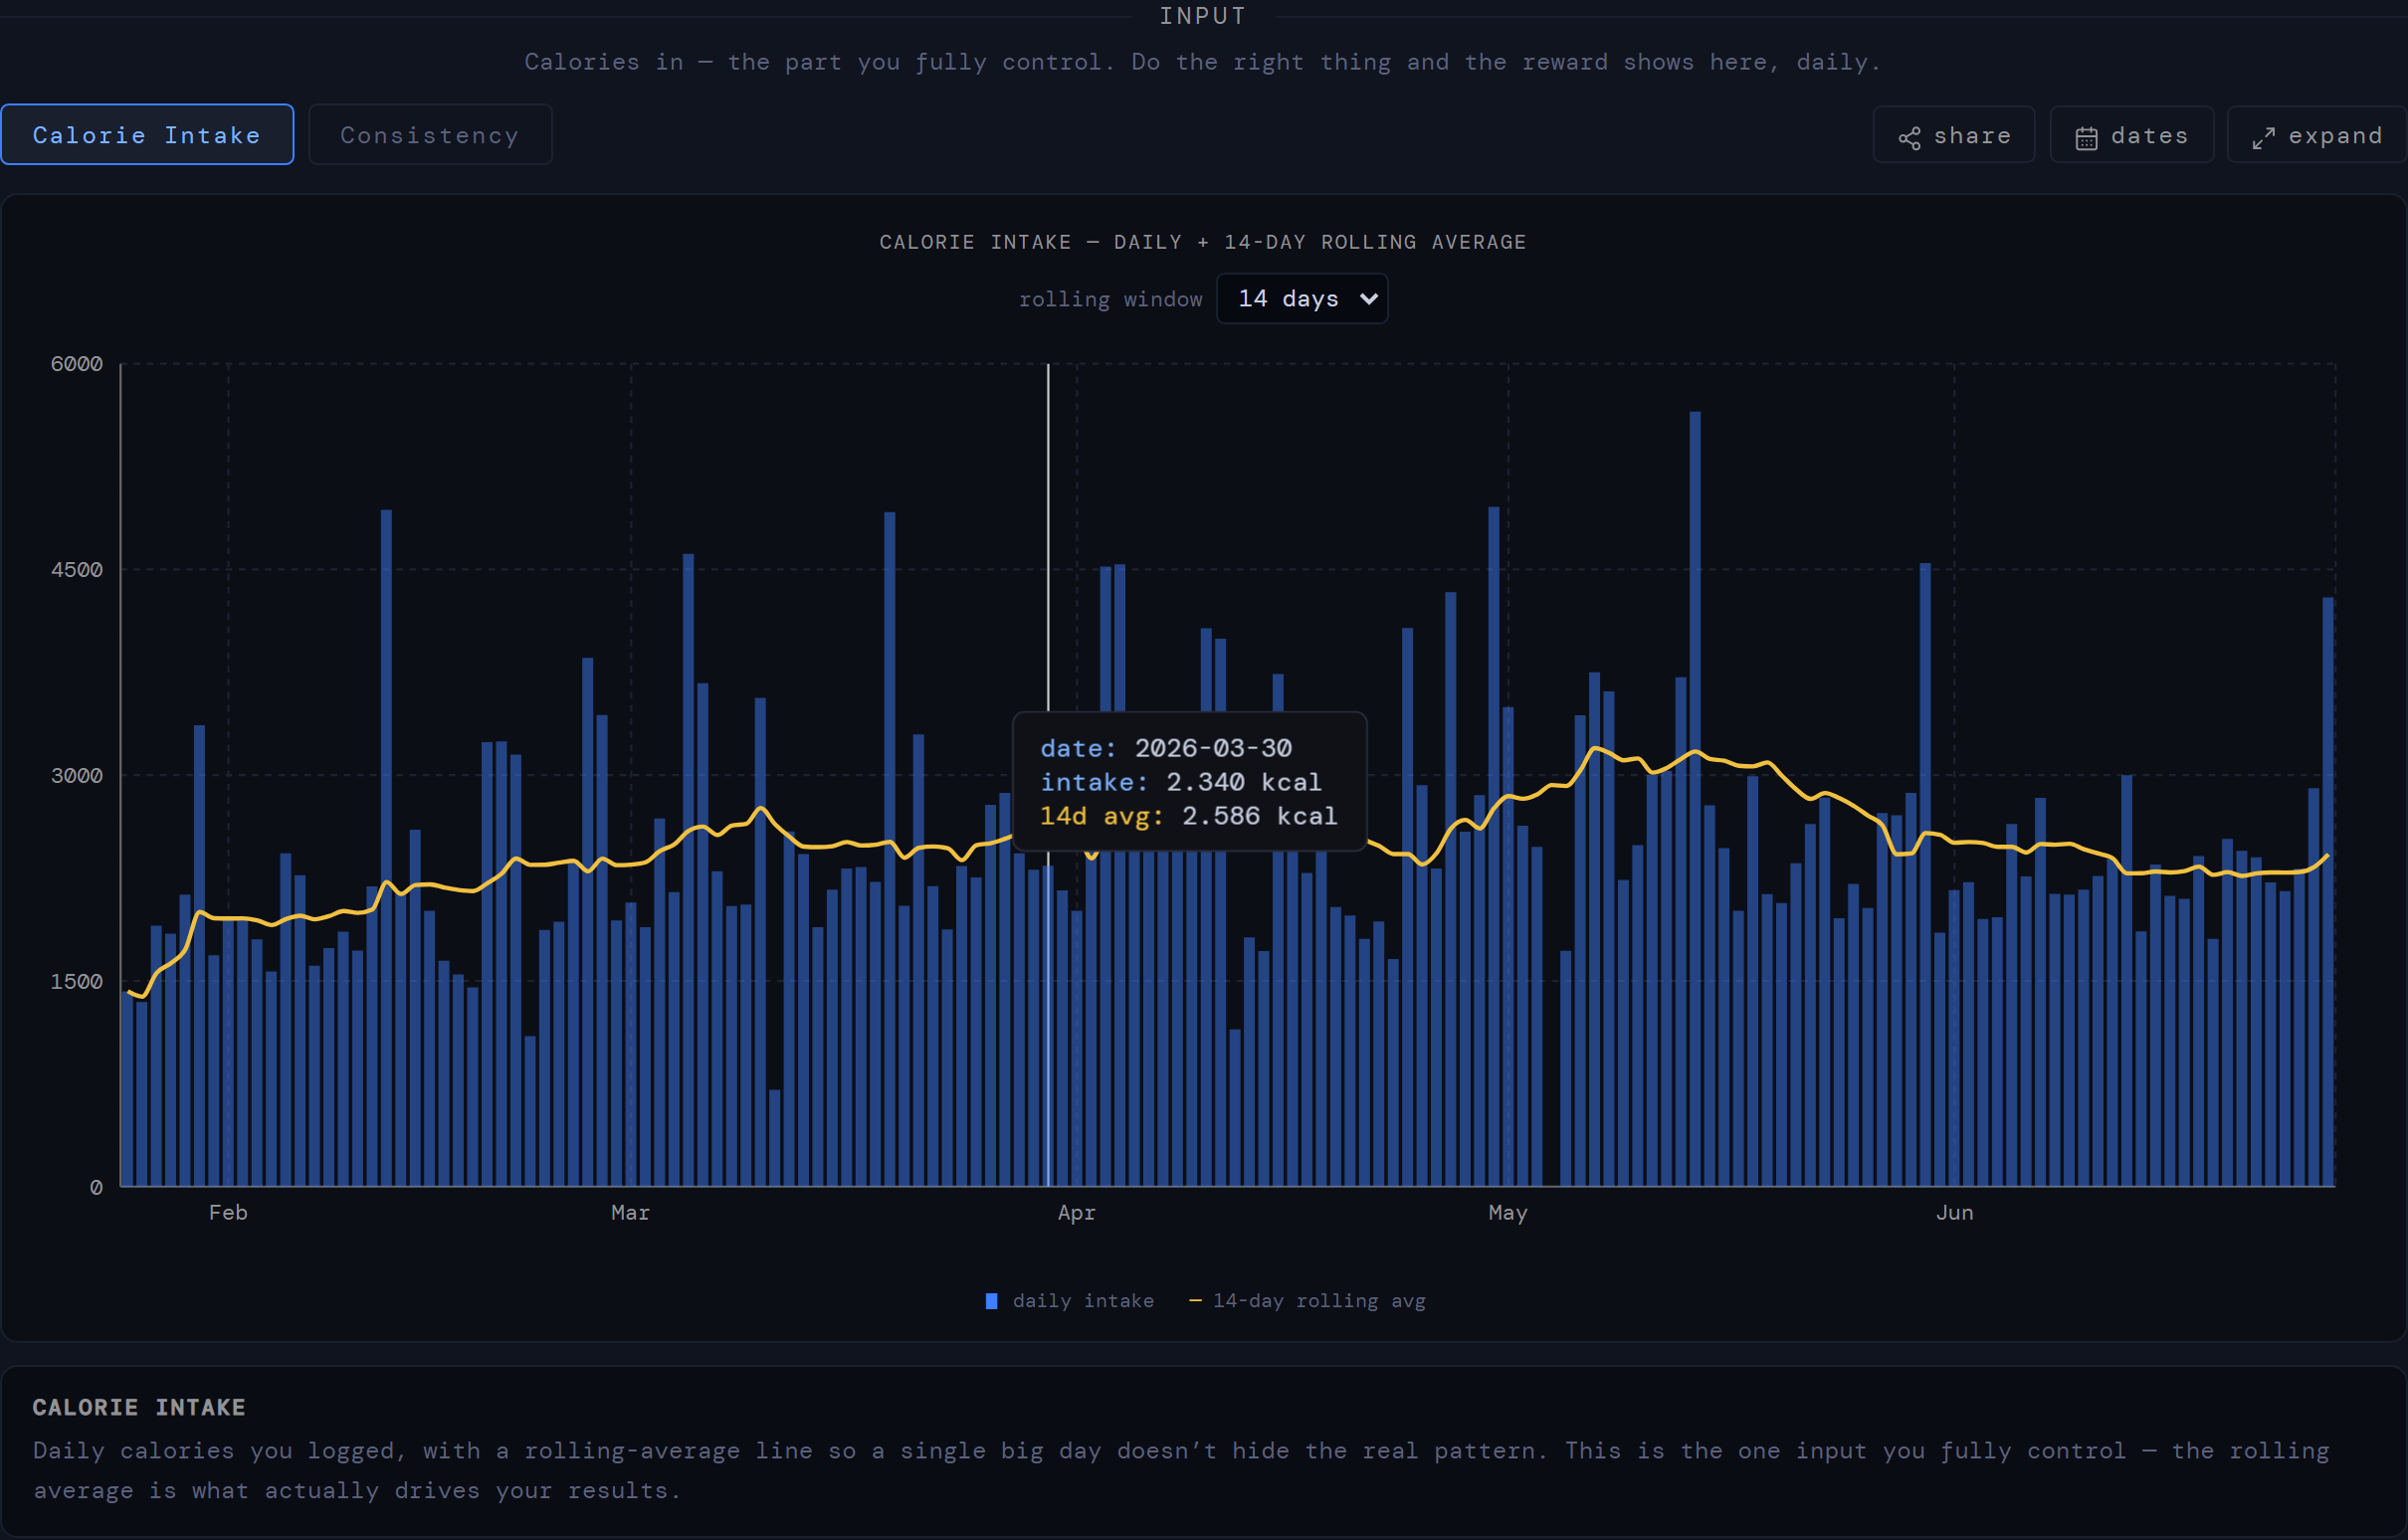
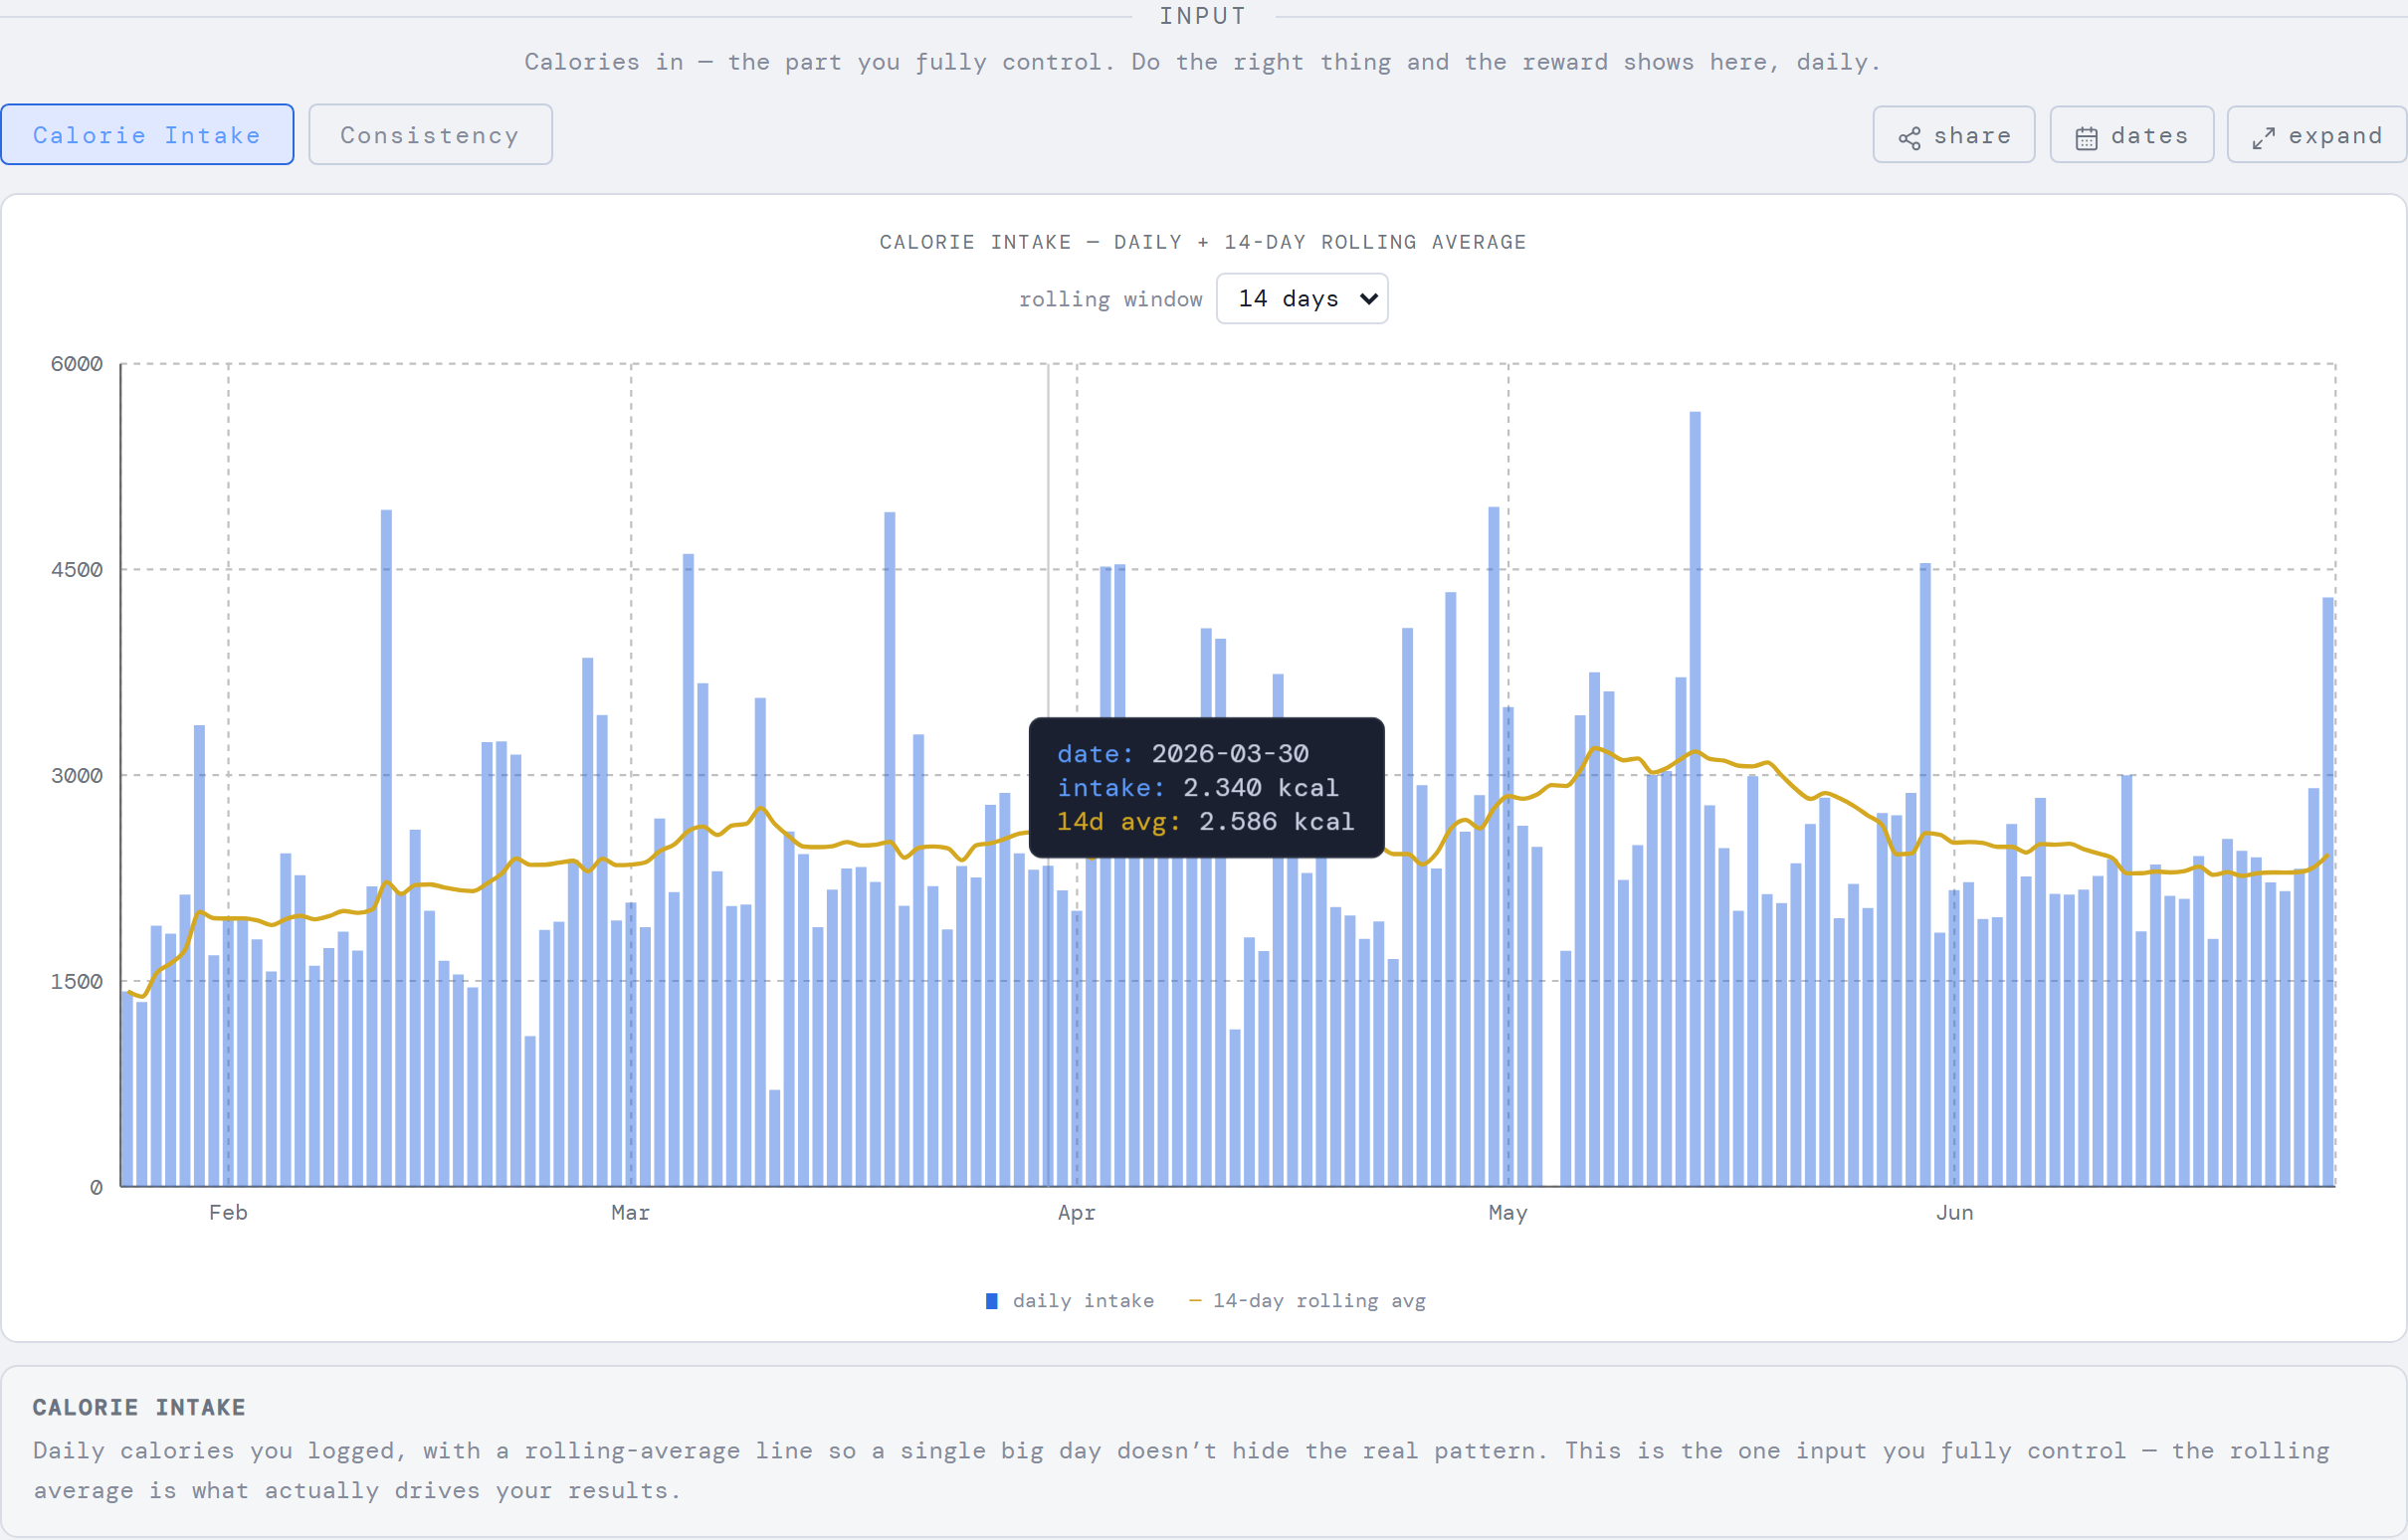
- Calorie Intake / Consistency (tabs) — switch between your daily calories and a view of how consistent you've been.
- Rolling window (dropdown, e.g. 14 days) — sets the span of the rolling-average line so one big day doesn't hide the real pattern.
Output — TDEE & deficit
The inferred engine: what your body's doing with that input.
- TDEE over Time / Daily Deficit / Diet Days (tabs) — your expenditure over time, your daily deficit, and a day-by-day diet view.
Outcome — weight results
The lagging, long-term payoff of all the input work.
- Weight + Rolling Avg / Weight Loss Rate / Rolling Avg Overlap (tabs) — your weight with a smoothing line, how fast it's changing, and an overlap view.
- Rolling window (dropdown) — trade responsiveness for smoothness on the average line.
The chart toolbar (every section)
Each chart section carries the same right-aligned buttons:
- Share — save or post a branded card of that chart. A chart that is still waiting for enough data has no Share button; there is nothing yet to put on the card.
- Expand — open the chart full-screen for a closer look (the same toolbar appears there, with a Close button).
Body Composition Projections
At the very bottom: today's rate projected toward a bodyfat goal.
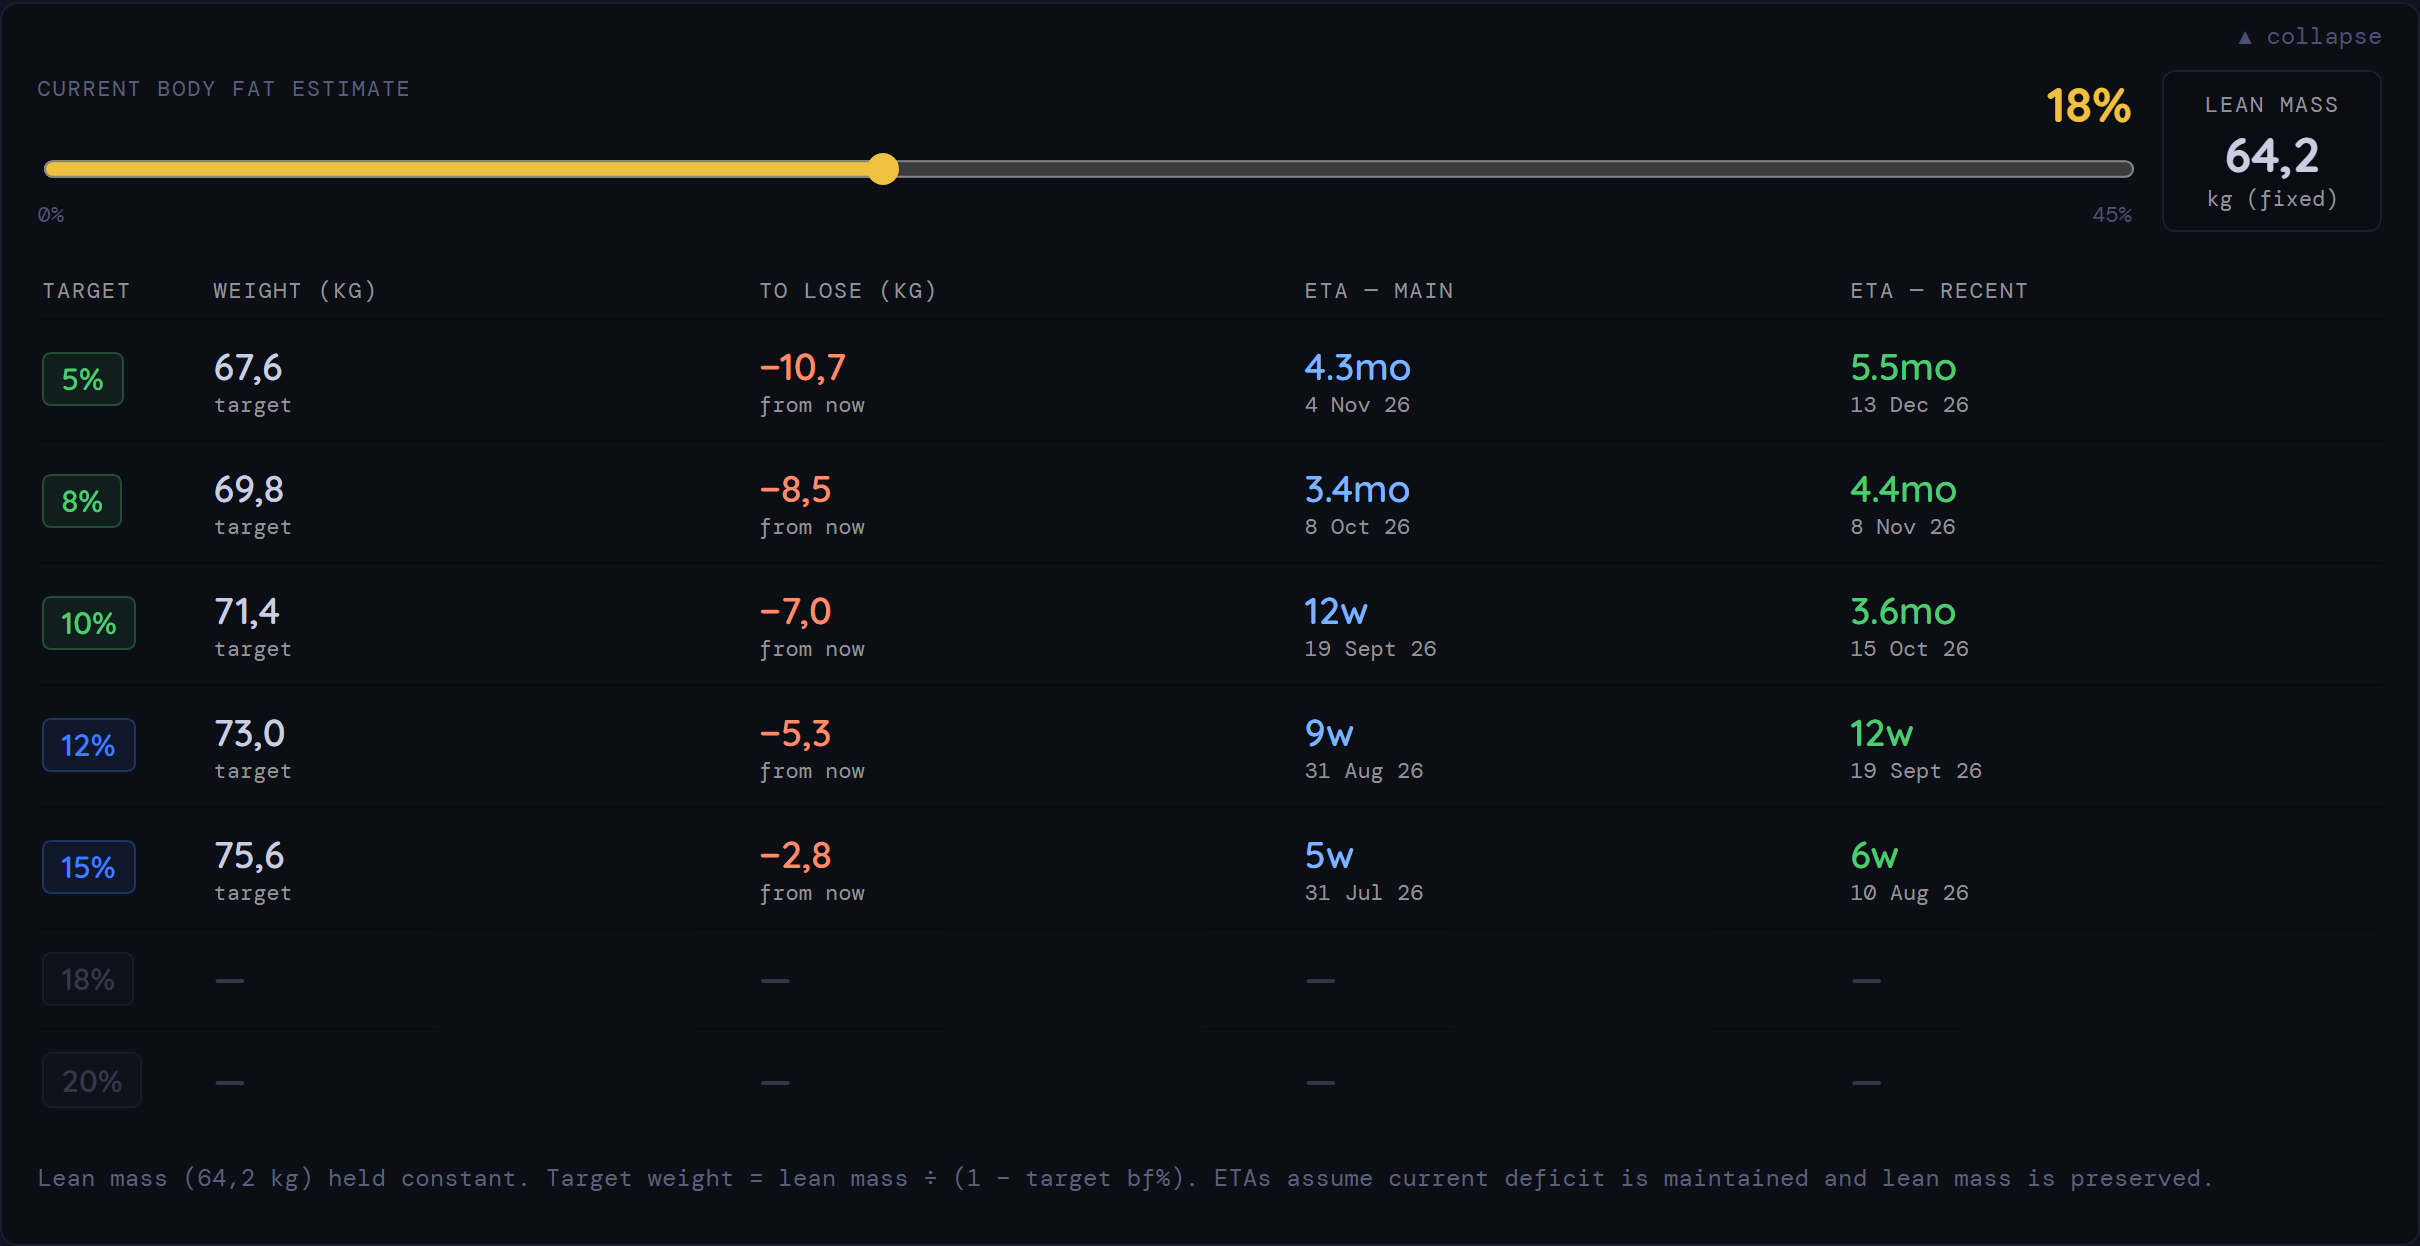
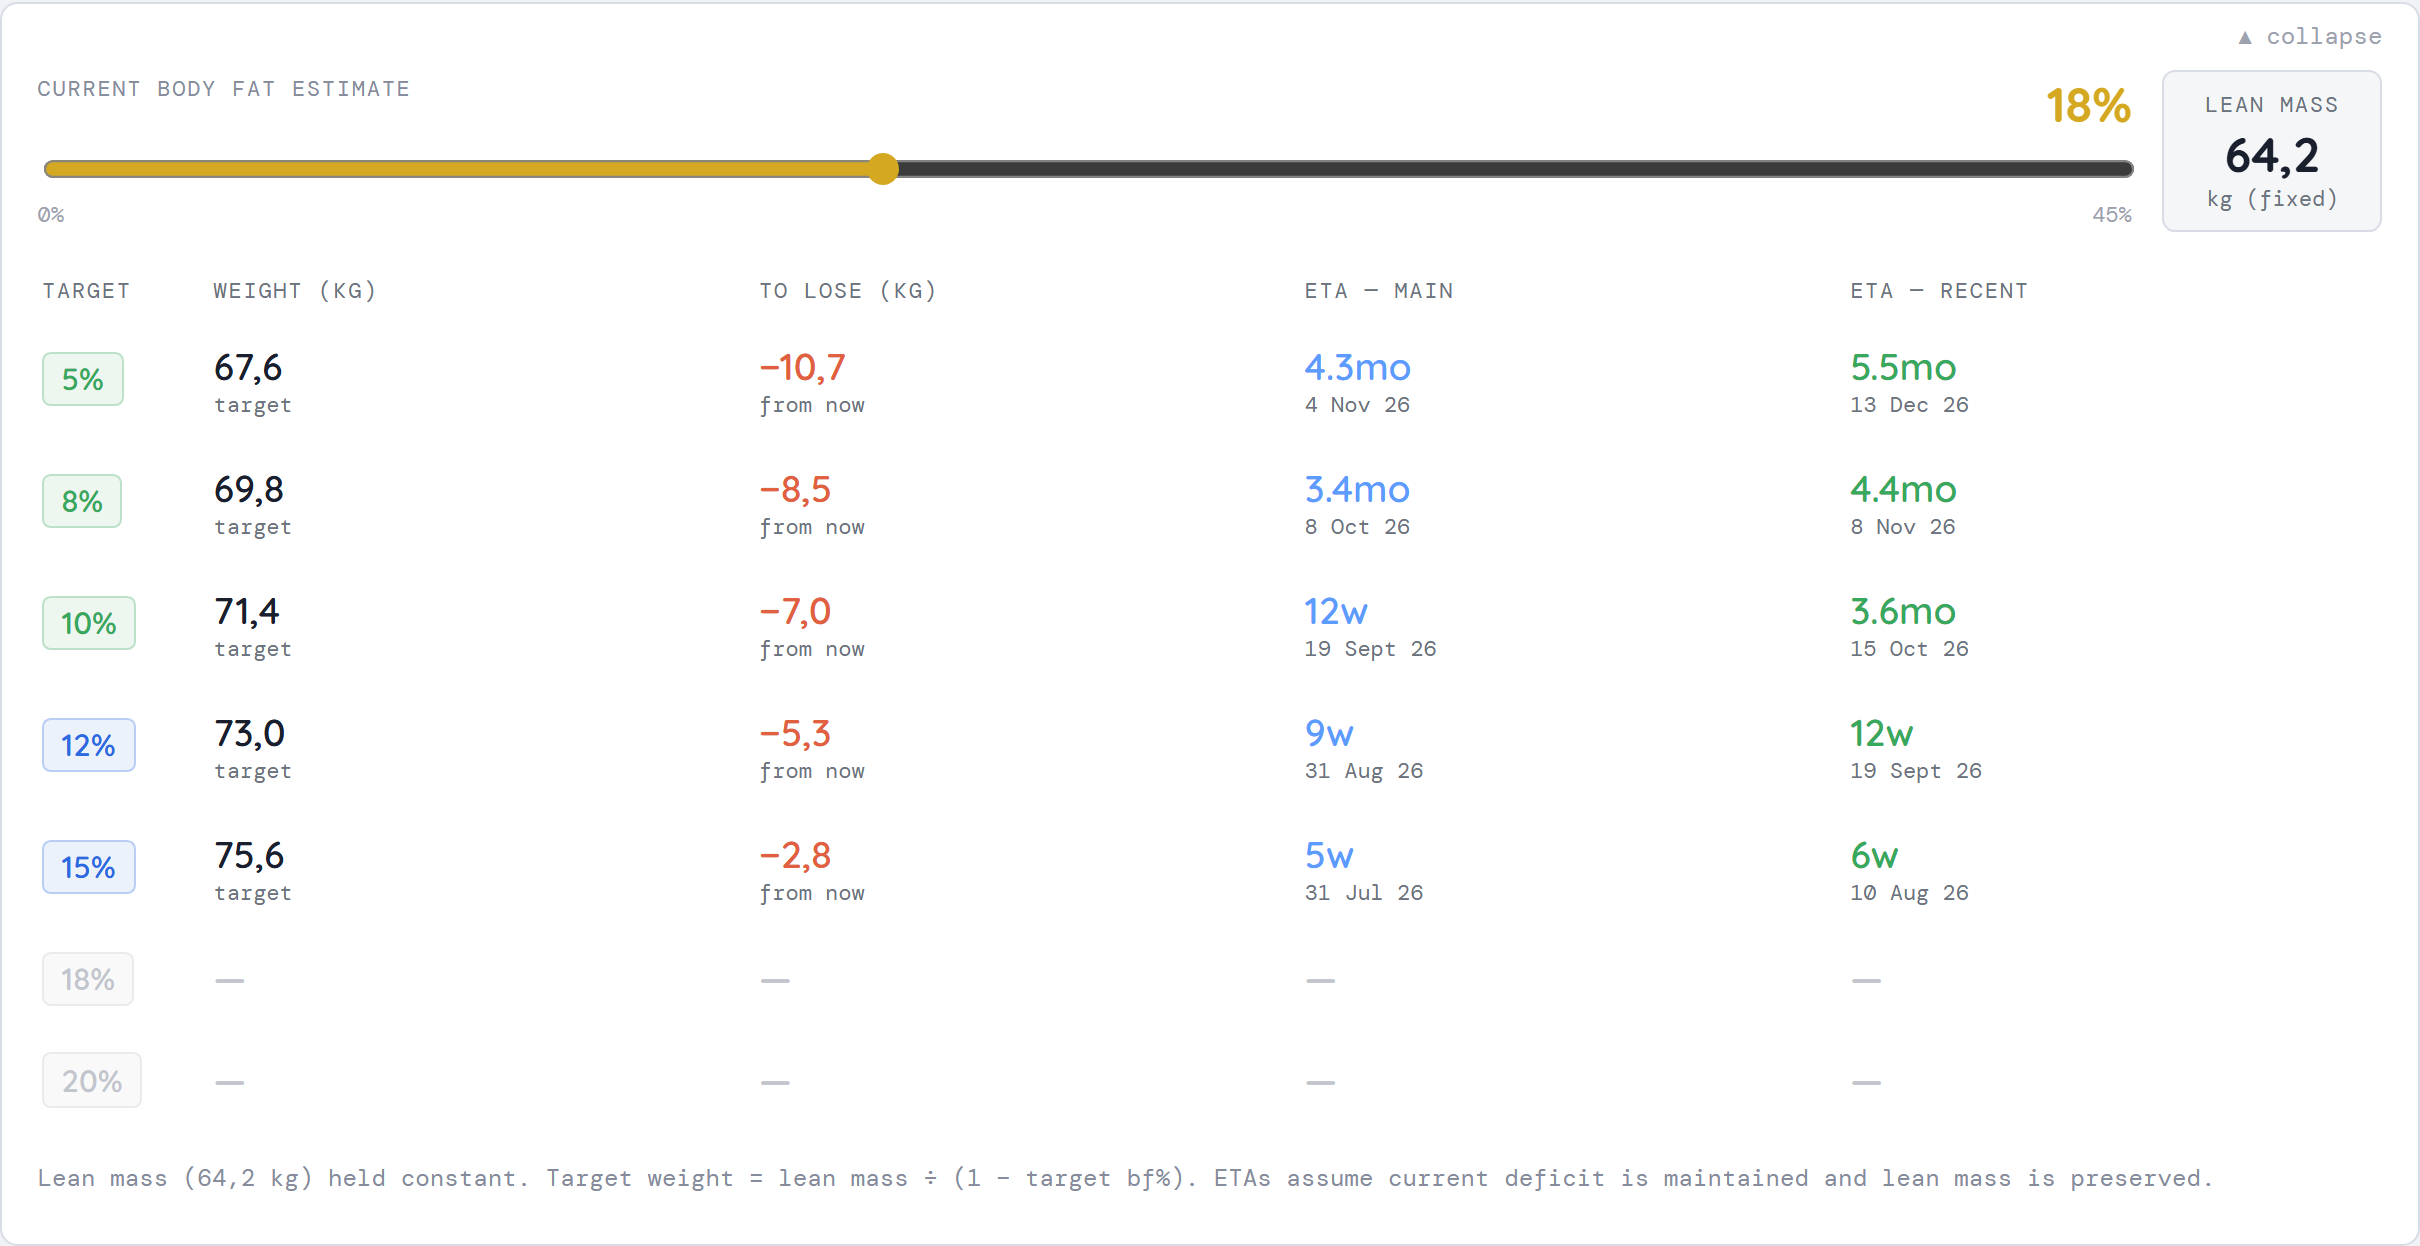
- Collapse / expand — hide or show the whole section.
- Current Body Fat Estimate (slider, 0–45%) — set your bodyfat; the table updates live.
- Lean Mass (readout) — your lean mass, held constant for the projections.
- Targets table — for each target bodyfat %: goal weight, kg to lose, and an ETA at both your main-period and recent rates, with arrival dates.
Your data (signed in)
The Data page appears once you're logged in — it's where your own numbers live.
- Current-dataset card — shows how many days you've logged, the date range, and where the data is stored. It also flags any missing or inferred days.
- Sync from Sheet — pull the latest rows from a linked Google Sheet on demand.
- Empty data — permanently delete your stored entries and sheet link (asks you to confirm first).
- Import & connect — feed your data in three ways: CSV upload, manual paste, or connect a Google Sheet. All three pass through the column mapper, where you match your columns to date / weight / calories.
- On import: Add/update vs. Replace all — merge new rows into what's stored (the default), or replace everything with this import.
- Data table — view, add, edit, and delete individual entries; every edit re-runs the calculations.
- Custom periods (premium) — define your own named date ranges (a diet phase, a year) with an attached perspective, to use as a dashboard period.
Goals (signed in)
- Desired Calorie Deficit (premium) — set your target deficit as either an absolute number (kcal) or a relative percentage; the two interlock off your main-period TDEE, and a live readout shows drift as your TDEE moves.
Account
- Sign up / Sign in — create or access your account; your data is stored privately.
- Preferences — your weight unit (kg/lbs) and how numbers read (1.234 vs 1,234, with the matching decimal style). Both follow your account across devices.
- Delete account — remove your account and its data.
Missing something or spot a button that's moved? Let us know via About → Contact.